RM-80 Loop Activity
Sep 23, 2025
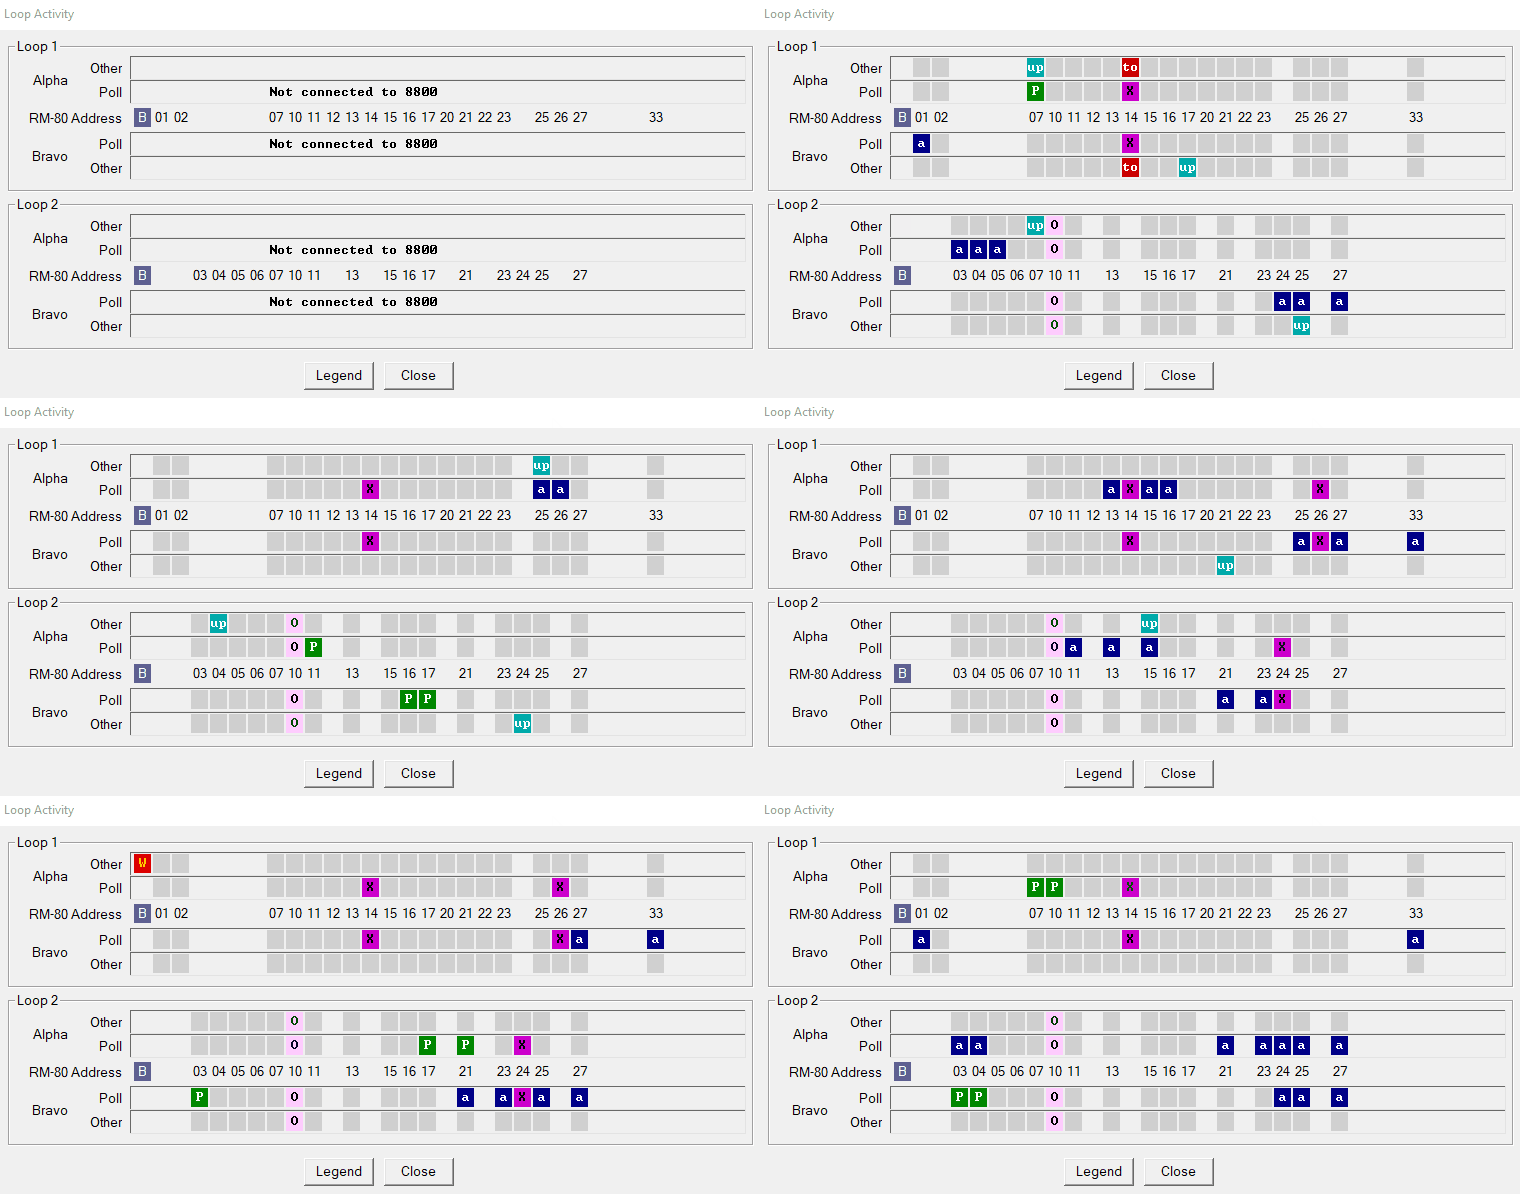
Within RMCS, the RM-80 Control program (rm80ctl) is responsible for all communication with the RM-80s. Primarily, that involves checking each RM-80 for new values and conditions. Also included is determining the current loop configuration, uploading/downloading RM-80 Item Databases and other RM-80 data requests and commands. This activity may be viewed in a graphical form by using the Loop Activity dialog (this is an animated GIF that runs for a couple minutes [yes, the pauses are part of the protocol]):

Sample Loop Activity
The sample above shows a few minutes of activity from a system that was (A) just starting up and (B) includes a couple of intentional RM-80 failures and recoveries.
The Loop Activity dialog shows information for each of the loops configured at your site (from 1 to 5 loops) using the colors/symbols shown below to indicate various activities:

Loop Activity Legend
In actuality, there will only be one active message on a single loop side — this dialog keeps the recent activities visible for a short time to improve readability. There is also only one communication channel on a loop side, but the dialog splits each side into POLL and OTHER in order to keep the normal data polling activity clearly separate from any additional activity.
Example Explanation
The example activity shows the following events:
- New connections are established between RMCS and the RM-8800s that physically
connect to the loops
- The text is replaced with colored activity blocks
- The loops are all configured
- The red blocks containing a 'W' in the first position indicate that RMCS is waiting to ensure that all RM-80s have activated their loop shutdown flags (this is a requirement for a full loop configuration)
- The 'W' changes to a 'C' as the RM-80s are polled for their IDs
- RM-80s that respond to the ID request are indicated with a blue block containing the text 'id'
- When the configurations are completed, the display shows one RM-80 that is marked OFFLINE (pink block containing 'O') in RMCS as well as one RM-80 that failed to respond to the configuration requests (magenta block containing 'X')
- Polling begins (green blocks containing 'P' and dark blue block containing 'a') while the current RM-80 database values are uploaded from all of the active RM-80s (cyan blocks containing 'up')
- A network communication error occurs, resulting in all of the loops being reconfigured again. Notice the difference between Loop 1 Alpha and the other three loop sides... Loop 1 Alpha is set to use a two pass (sometimes called 'hard') configuration method while the other three are set to use a one pass (sometimes called 'soft') configuration method
- Once the loops are operating normally, an RM-80 was bypassed. When the bypass is detected, the RM-80 shows the loss of communication. You may also notice occasional attempts to recover the RM-80 in case the comm loss was a transient issue or the RM-80 has been unbypassed (or powered back on)
- Loop 1 Alpha triggers an automatic loop configuration, "hoping" to re-discover the lost RM-80(s)
- Then an RM-80 is bypassed on Loop 2. When the bypass is detected, Loop 2 starts making periodic attempts to "soft" recover the missing RM-80(s) without requiring a full loop configuration
- When the RM-80 on Loop 1 is unbypassed, the loop starts detecting communication issues with additional RM-80s, due to the Loop Shutdown conditions on the recently unbypassed RM-80 and eventually triggers a configuration
- When the RM-80 on Loop 2 is unbypassed, the loop also starts detecting communication issues with additional RM-80s, but these are quickly correctly using the soft configuration recovery method
While this tool may be a useful diagnotic utility, it may be even more useful to help system engineers understand exactly how the loop conmunication is performed and how the various types of activity may impact that communication.